It’s for you if
- Nothing on your team is being tracked right now, or it’s tracked somewhere nobody opens.
- You want to know which rep has an opening problem, which has a conversation problem, and which has stopped working.
- You’ll give it two minutes at the end of the day, not twenty.
How buying works
- Pay on Stripe. The checkout shows Holt Ventures LC, the company that publishes The Doorstep Playbook.
- Your download page opens as soon as the payment goes through.
- Open it in Excel, Google Sheets or Numbers and start on the Start Here tab. Its first five steps link to the cells you fill in.
It does the diagnosis for you
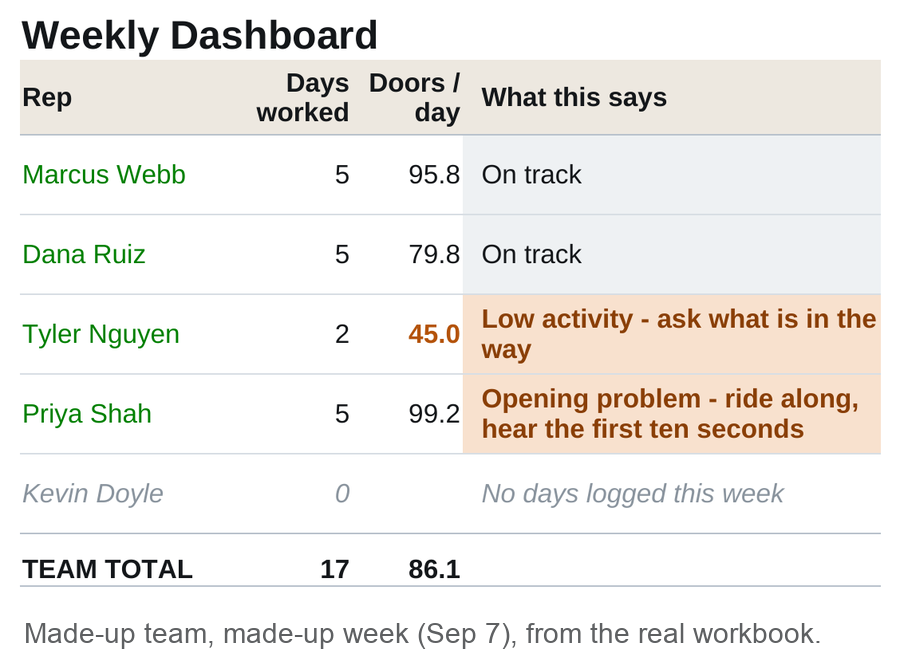
This is the part worth the seventeen dollars. The Weekly Dashboard has a final column, “What this says”, that reads each rep’s numbers against your own team average and names the likely problem:
- Low activity — ask what’s in the way
- Opening problem — ride along, hear the first ten seconds
- Conversation problem — coachable, find where it dies
- On track
Those are three completely different problems that look identical on a sales report, and they need opposite responses. The column compares against your own team, so it gets sharper the more days you log. Two columns beside it flag a rep who is missing days and count each rep’s days on the team. A rep in their first 30 days gets a blue-gray fill on their name and day count, and their verdict runs on the same rules as everyone else’s, so read it knowing they’re new.
Rendered from the real workbook with a made-up team typed in. Tap an image to open it full size.
One week, as the tab actually returns it
Five people on the roster: four working, plus Kevin, who left in July and stays on the roster so the turnover math still sees him. Somebody typed doors, conversations and sales for each rep each day into the Route Log, and nothing else was entered anywhere. This is the Weekly Dashboard for that week, rep by rep, with the verdict in bold.
- Marcus Webb — 5 days, 479 doors, 119 conversations, 14 sales. 24.8 conversations per 100 doors, 11.8 sales per 100 conversations, 2.9 sales per 100 doors. → On track
- Dana Ruiz — 5 days, 399 doors, 93 conversations, 8 sales. 23.3 conversations per 100 doors, 8.6 sales per 100 conversations, 2.0 sales per 100 doors. → On track
- Tyler Nguyen — 2 days, 90 doors, 15 conversations, no sales. 16.7 conversations per 100 doors, 0.0 sales per 100 conversations, 0.0 sales per 100 doors. → Low activity — ask what is in the way, and the attendance flag: Missing days — call today
- Priya Shah — 5 days, 496 doors, 54 conversations, 3 sales. 10.9 conversations per 100 doors, 5.6 sales per 100 conversations, 0.6 sales per 100 doors. → Opening problem — ride along, hear the first ten seconds
- Kevin Doyle — nothing logged; he left in July. → No days logged this week
- Team total — 17 days, 1,464 doors, 281 conversations, 25 sales. 19.2 conversations per 100 doors, 8.9 sales per 100 conversations, 1.7 sales per 100 doors.
A made-up team on a made-up week, run through the real workbook. The figures are invented to show what the tab returns. None of them is a benchmark, and the file never compares you to anyone but yourself. Inside the workbook the two rates display as percentages; here they’re written per 100.
Read the bold and the week takes about ten seconds. Tyler knocked 90 doors across two days, 45 a day against a team average of 86.1, so he reads as low activity rather than as a bad closer, and the conversation to have with him is about what is in the way, not about technique. Priya out-knocked everybody on the team and got the fewest conversations out of it, which is an opening problem and the easiest thing on this page to fix. A sales report would have shown you Tyler on nothing and Priya on three, and told you they had the same problem.
The Tracker is one Excel workbook with 9 tabs. You type doors, conversations and sales for each rep each day, and the “What this says” column on the Weekly Dashboard names each rep’s likely problem.
Instant download · Refundable for 30 days, no questions asked
Why a spreadsheet
Because the elaborate ones don’t survive a bad week. Anything that needs more than a couple of minutes at the end of a shift gets kept up briefly and then quietly stops, and half-filled data is worse than none: you can’t trust it, so you don’t act on it. This one asks for three numbers per rep per day, doors, conversations and sales, and calculates everything else.
Sales is a lagging indicator. By the time it moves, whatever caused it has already happened, and if the cause was disengagement the rep has often already decided. The point of this workbook is the numbers that move first.
The nine tabs
- Start Here. “Your first 10 minutes” in five linked steps, what each tab does, the weekly rhythm, and a color legend. The roster, route log and territory tabs each have one example row, which every total leaves out.
- Team Roster. Name, start date, status, comp plan. Days on team and whether each rep has passed 30, 60 and 90 days calculate automatically.
- Route Log. One row per rep per day, and two streets in one day is fine: a row for each still counts as one day. Conversation rate, close rate and sales per 100 doors fill themselves in. 300 rows ready to go.
- Weekly Dashboard. Set a week-start date and the whole tab rebuilds from the route log: days worked, doors, conversations, sales, conversation rate, close rate, doors per day and sales per day, per rep and for the team, plus the attendance flag, days on team and the diagnosis column. The reps to act on this week are shaded orange.
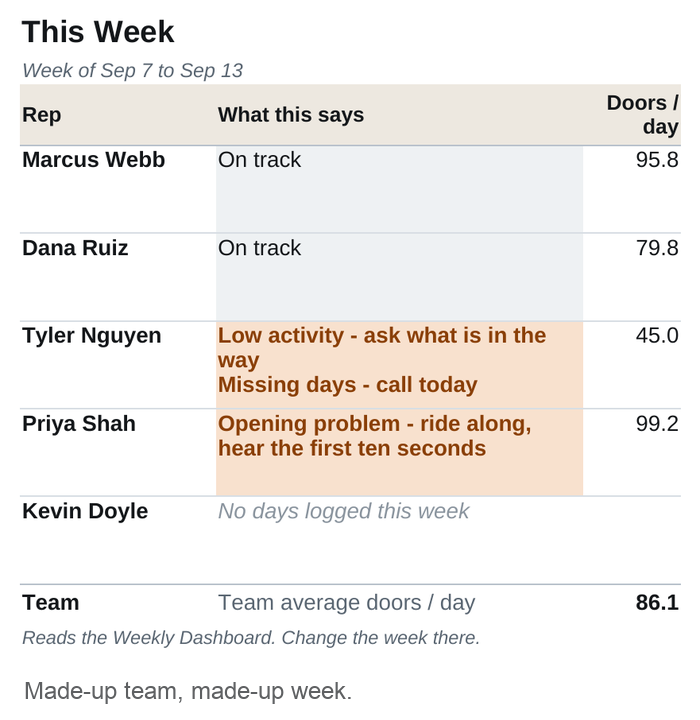
- This Week (phone). The same week in three narrow columns: rep, what this says, doors per day.
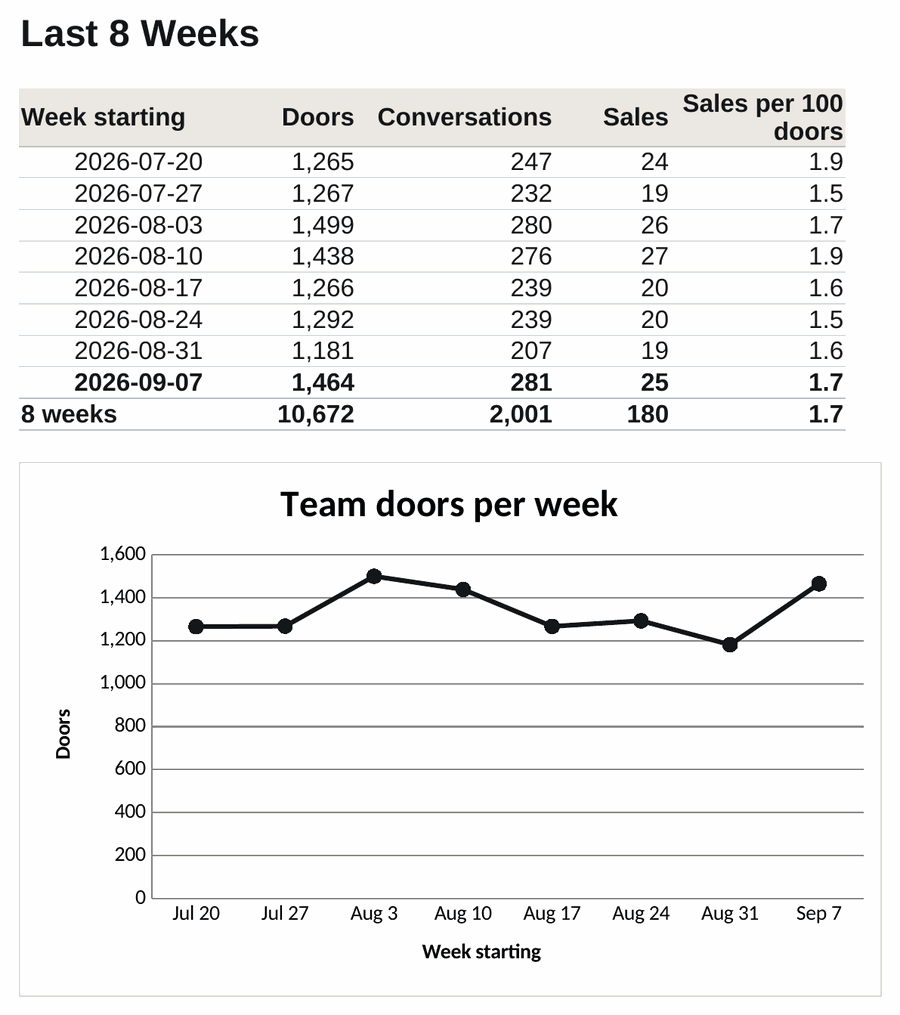
- Last 8 Weeks. Team doors, conversations, sales and sales per 100 doors for the eight weeks ending with the dashboard’s week, with a chart of doors per week.
- Turnover Tracker. Reads the roster automatically: turnover to date, median days for reps who left, and 30/60/90 survival. Plus the four leading indicators and when to act on each.
- Comp Calculator. Straight commission, draw and hybrid side by side for one rep at one sales volume: take-home, draw balance carried forward, implied monthly take-home, and company cost against gross generated.
- Territory. Doors available against doors worked, days since last worked, and a flag for which areas are due for another pass on the interval you set. Last worked and doors worked fill in from the Route Log.
The comp calculator also takes a chargeback / fee rate, whatever comes off a rep’s commission in your arrangement, so you can see what a clawback structure does to actual take-home before you put it in front of anyone. Set it to zero if it doesn’t apply to you.
Technical details
- Standard .xlsx. Opens in Excel, Google Sheets and Numbers.
- No macros, no add-ons, no external connections, nothing to install.
- 2,557 formulas, all built from ordinary functions, recalculated and checked for errors before release. The diagnosis logic was tested against made-up data for every verdict it reports, and the arithmetic was checked by hand.
- Input cells are yellow with blue text; everything else is a formula. Dropdowns keep rep names consistent between tabs.
- Every tab is set up to print one page wide. The Weekly Dashboard prints on a single page.
- Built for 40 reps, 300 route-log rows and 80 territory areas. To go past that, insert new rows above the last row of the list, so every formula’s range grows with it. The Weekly Dashboard lists the first 40 reps.
What it doesn’t do
It doesn’t connect to your CRM, it doesn’t sync between devices, and it doesn’t have an app. It’s a file. If you need a system, buy a system. This is for the very common case where the honest answer is that nothing is being tracked at all, and the fix is one file that a person will actually keep up with.
Every number in it comes from data you enter. Nothing is benchmarked against outside figures, and no targets are assumed.
Format and delivery
Excel workbook, available immediately after checkout. Refundable for 30 days, no justification needed. See the refund policy.
Checkout is on Stripe and shows Holt Ventures LC, the company that publishes The Doorstep Playbook.
The free Doorstep Route Planner is the paper version of the same idea. Start there if you’d rather try before you buy. Or read the four numbers this workbook is built around.