Doors per day, conversation rate, close rate, and 30/60/90 survival. That is the list. Your reps log three raw fields at the end of a shift — doors, conversations, sales — and the first three of those four numbers are just divisions of two of them. The fourth comes off your roster.
The reason to bother is that sales is a lagging indicator. By the time a rep’s sales drop, whatever caused it happened one to three weeks ago, and if the cause was disengagement, they have usually already decided to leave. You are not managing at that point. You are being informed.
These four move first, and each one comes with a diagnosis attached. The second half of this article is the part most metric lists leave out: the written rule for turning them into a diagnosis on a Monday morning, run on a real week of numbers, and the four situations where that rule is wrong.
1. Doors per day
Effort, in its rawest form, and the earliest visible sign that someone is checking out.
People stop knocking before they stop showing up, and they stop showing up before they quit. A rep whose door count falls two days running is telling you something, usually before they’ve told themselves. That’s a window of about a week where the situation is still recoverable. And it is worth running on the best rep at the top of your board, not only on the reps you are already worried about — nobody is watching that door count, which is exactly why it drifts unnoticed.
The response is not a warning. It’s a private, direct question: “Something feels different — what’s going on?” Asked in the first week of the drift, that recovers a meaningful share of people. Asked three weeks later, you’re being told about a decision rather than participating in one.
2. Conversation rate
Conversations divided by doors. How many knocks turned into an actual exchange. It isolates one specific skill: the first ten seconds.
This is the number that separates two failures that look identical on a sales report. Two reps can knock the same doors, put up the same weak week, and be failing at completely different things — one of them never gets past the doorstep, the other gets into the conversation and loses people inside it. Nothing on a sales report tells those apart. Conversations divided by doors does it in one column.
An opening problem is one of the fastest things in this business to fix, and it is almost impossible to spot without this number. It also requires a specific kind of coaching: you have to stand next to them and hear the first sentence, not review their numbers over the phone. That is what a ride-along is for.
3. Close rate
Sales divided by conversations — not by doors. This is conversation skill with volume stripped out.
Measured against doors, a hardworking rep with a weak pitch and a lazy rep with a strong one can produce the same figure, and you’d coach them identically and be wrong both times. Measured against conversations, they separate immediately.
A rep with normal activity, a normal conversation rate and a low close rate is the most valuable person on your board, because that is the most coachable failure there is and the most commonly cut by mistake. They are knocking, getting rejected, and coming back. Ride along and find the specific point where their conversations die — it’s usually one objection they’ve never had a good answer for.
4. 30/60/90 survival
Of everyone you have ever put on the roster, what share reached 30 days? What share reached 60, and 90? Large organizations cut this by start month and watch the curve move from one intake to the next. On a team that hires four people a year a start-month cohort is a group of one, the curve is noise, and you are better off running it across every hire you have made and letting the denominator get useful slowly.
This is the only one of the four that grades you rather than your reps, which is exactly why it’s worth having. If fewer than half of your hires reach 30 days, the problem is in your first week, and no amount of additional recruiting will fix it — you’ll just run more people through the same experience.
It also gives you a real recruiting number. If six in ten survive to 90 days and you need six productive reps, you recruit ten. Without this figure, you’re guessing at headcount and permanently hiring.
The rule: compare each rep to your own team, not to a benchmark
Everywhere else you will read that a healthy conversation rate is such-and-such and a healthy close rate is such-and-such. Ignore all of it. Those ranges are pulled from different products, different price points, different door types and different definitions of the word “conversation.” Fiber in a townhouse development and pest control on quarter-acre lots do not share a number, and neither of them shares yours.
What you have that no benchmark has is four people working the same offer in the same city in the same week. So make the comparison internal. Here is the rule, in the order it has to run:
- No days logged this week? Stop. No diagnosis. A rep who was on vacation is not a rep with a problem, and dividing by zero days invents one.
- Doors per day below 0.6 times the team’s? Low activity. Stop there — do not read his ratios at all this week. They are built on too few doors to mean anything, and an activity problem has to be solved before a skill problem is visible underneath it.
- Conversation rate below 0.7 times the team’s? Opening problem. He is knocking and not getting in.
- Close rate below 0.7 times the team’s? Conversation problem. He is getting in and losing people inside.
- None of the above? On track. Say so out loud, to him, this week.
The order is the part people get wrong. Run it top to bottom and stop at the first line that fires. A rep who knocked eighty doors all week can show you a spectacular close rate off two conversations, and if you read his ratios before you read his activity you will praise him for it.
The 0.6 and the 0.7 are mine, not anyone’s finding. I picked them to be loose enough that an ordinary bad week does not trip them and tight enough to catch a rep who is genuinely behind the people standing next to him. Move them if your team says otherwise — but write down what you moved them to, because a threshold you re-decide every Monday is not a threshold.
One week, four reps, the whole calculation
Invented numbers, deliberately uneven, because a real week is never four people who all worked five days. Here is what the log holds on Friday night:
- Dana — 5 days, 455 doors, 96 conversations, 8 sales
- Marcus — 5 days, 430 doors, 52 conversations, 4 sales
- Priya — 4 days, 268 doors, 90 conversations, 4 sales
- Tyler — 3 days, 132 doors, 31 conversations, 2 sales
Look at that list the way a sales report shows it to you — 8, 4, 4, 2 — and Marcus and Priya are the same person. They are not. They have almost nothing in common.
Team first. Add the columns: 17 rep-days, 1,285 doors, 269 conversations, 18 sales. Three divisions:
- 1,285 ÷ 17 = 75.6 doors per day
- 269 ÷ 1,285 = 20.9 conversations per 100 doors
- 18 ÷ 269 = 6.7 sales per 100 conversations
Then the three lines. 0.6 × 75.6 = 45.4 doors per day. 0.7 × 20.9 = 14.6 per 100 doors. 0.7 × 6.7 = 4.7 per 100 conversations. Those three numbers are your whole Monday. Now run each rep through them.
- Dana. 455 ÷ 5 = 91.0 doors a day, clear. 96 ÷ 455 = 21.1 per 100 doors, clear. 8 ÷ 96 = 8.3 per 100 conversations, clear. On track — and the best week on the board, which is worth a sentence to her face.
- Marcus. 430 ÷ 5 = 86.0 doors a day, clear. 52 ÷ 430 = 12.1 per 100 doors, and the line is 14.6. Opening problem. Stop reading; his close rate is fine and it is not the thing to talk about.
- Priya. 268 ÷ 4 = 67.0 doors a day, clear. 90 ÷ 268 = 33.6 per 100 doors, the best opening on the team by a distance. 4 ÷ 90 = 4.4 per 100 conversations, and the line is 4.7. Conversation problem.
- Tyler. 132 ÷ 3 = 44.0 doors a day, and the line is 45.4. Low activity. Stop there. His 23.5 per 100 doors and 6.5 per 100 conversations are both ordinary, and neither is the conversation to have this week.
Marcus and Priya both sold four. Marcus knocked 162 more doors than Priya to get there and had 38 fewer conversations. He is burning a street a day to find people he never gets to talk to; she is getting a third of her doors to open and then losing them. Same row on the sales report. Opposite coaching. Neither conversation is findable without the middle column.
The conversation rate is a weekly number. The close rate is a monthly one. Reading them on the same Monday is the most common way this goes wrong.
Where this rule is wrong
1. The close rate has too small a denominator to flag anybody on
This is the big one, and it is why the two flags above are not equally trustworthy.
Ask what an ordinary week looks like for a rep who is genuinely average — whose real rates are exactly the team’s. Marcus logged 430 doors. If his real conversation rate were the team’s 20.9 per 100, then about 95 weeks out of a hundred he lands somewhere between 17.2 and 24.9 per 100 doors. He landed on 12.1. Chance alone produces a week that bad roughly once in a million. That flag is real.
Priya logged 90 conversations. If her real close rate were the team’s 6.7 per 100, then about 95 weeks out of a hundred she lands between 2.2 and 12.2 per 100 conversations — and four sales in ninety conversations, or worse, happens about 27 times in a hundred. More than one week in four, that flag fires on somebody who is fine.
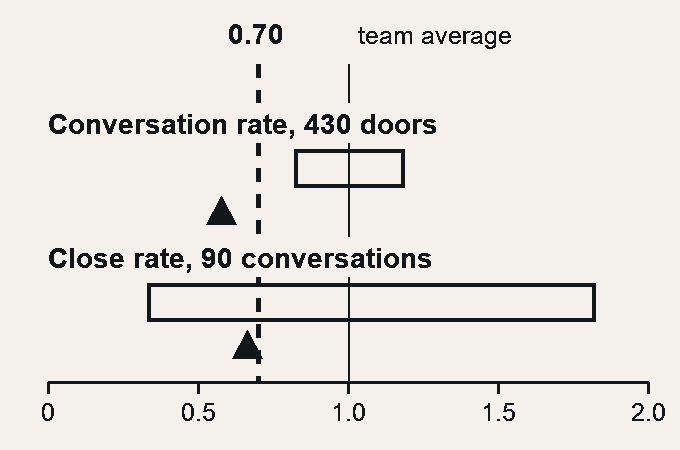
Same threshold, same rule, two completely different levels of evidence — and the only thing that changed is the size of the denominator. A week gives a rep four hundred doors and ninety conversations. Four hundred is enough to see an opening. Ninety is not enough to see a closer.
So use them on different clocks. A conversation rate settles to within about two per 100 doors after roughly four hundred doors, which is a week for most reps — the same arithmetic, run on a single rep, is worked through in the piece on the first ten seconds. A close rate at around 6.7 per 100 needs roughly 150 conversations to settle that far, and at eighty doors a day that is about nine working days. Flag an opening on the week. Flag a closer on the month.
In practice: Marcus gets the conversation on Monday. Priya gets watched, and gets a ride-along because a ride-along costs you an hour and tells you something a spreadsheet cannot. She does not get told she has a closing problem until the number has held for a month.
2. On a small team, the rep is inside his own benchmark
The team average includes the rep you are comparing to it, so a weak rep drags the line down toward himself, and the fewer colleagues he has the more he drags it.
Take a rep who knocks 50 doors a day, every week, on a team where everyone else does 100 and everyone works the same days. With one colleague, the team average is 75, the line is 45, and he passes. With two colleagues the average is 83.3, the line is exactly 50.0, and he is sitting on it. With three the average is 87.5, the line is 52.5, and he is flagged. He knocked the same 50 doors all three times.
The rule is a comparison, not a verdict. On a team of two or three it is barely even a comparison. Below about four reps, use the numbers to start a conversation and nothing else.
3. The territory is different, and the ratio blames the rep for it
A conversation rate is partly a fact about the doors, not only about the person standing at them. A rep working a hundred-unit building and a rep working half-acre lots are not running the same test, and neither are a rep on a fresh map and a rep re-working a street that has already been knocked once. Neither is morning against evening.
Before you diagnose an opening problem, check whether the rep was somewhere different. If your territory assignments move week to week, this rule is measuring your map as much as your people, and the fix is on the map.
4. Two reps are counting the same thing differently
Every ratio here rests on two words your team has probably never been given a definition for. Is a house where nobody comes to the door a door? Is a voice through a doorbell camera a conversation? Is “not interested” through a closed screen?
If one rep counts a no-answer and another leaves it off, you are not comparing two people. You are comparing two measuring instruments, and the team average they both get judged against is a blend of the two. It costs one sentence at a team meeting to settle, and it quietly invalidates every ratio on this page if you skip it. Write your two definitions down, say them out loud once, and then leave them alone until the quarter ends — changing a definition mid-stream makes this week incomparable to last week as well.
The Monday sheet
Copy this onto a sticky note or the back of your route map. It is six divisions and it takes about four minutes.
THE TEAM, THIS WEEK
- Total doors ______ ÷ total rep-days ______ = ______ doors per day
- Total conversations ______ ÷ total doors ______ = ______ per 100 doors
- Total sales ______ ÷ total conversations ______ = ______ per 100 conversations
MY THREE LINES, THIS WEEK
- Low activity, below ______ × 0.6 = ______ doors per day
- Opening problem, below ______ × 0.7 = ______ per 100 doors
- Conversation problem, below ______ × 0.7 = ______ per 100 conversations
EACH REP, IN THIS ORDER. No days logged → skip. Doors per day under the first line → low activity, stop. Conversation rate under the second → opening problem, stop. Close rate under the third → conversation problem, and only act on it if it has held for a month.
The reps’ half is three numbers at the end of a shift. Ask for it as a text in one fixed format — doors 84, conversations 19, sales 2 — because a rep who has to open an app will stop doing it in week three, and the day he stops is usually the first day worth knowing about.
Four, not fourteen
The temptation once you start measuring is to measure more. Resist it. A tracker with fourteen columns gets filled in for two weeks and abandoned, and a metric nobody logs is worth less than no metric at all — it just costs you the credibility to ask for the next one.
Three fields per rep per day — doors, conversations, sales — produce every ratio above. It takes about two minutes at the end of a shift. Anything that takes longer than that will not survive a bad week, and bad weeks are exactly when this data matters most.
One warning about using them
Activity metrics turn hostile the moment they become a stick. If doors per day is only ever mentioned when someone is in trouble, reps will inflate it, and you’ll have destroyed your own early-warning system in exchange for nothing.
Frame them as what they actually are: the part of the job the rep controls. On a week where nothing closed, the door count is the only evidence that the week wasn’t wasted. Used that way, reps log honestly — and honest logs are the entire point.
Start tomorrow morning
Do not build a system. Send one message to your team tonight with your two definitions in it — what counts as a door, what counts as a conversation — and ask for three numbers by text at the end of every shift this week. That is the entire setup.
On Friday, add the four columns, do the six divisions above, and run your reps down the list in order. You will get one diagnosis per person and at least one of them will be a rep you had filed under the wrong problem. Then have that conversation on Monday, and let the close rates sit until the end of the month.
Route & Team Tracker
If you would rather not do the six divisions by hand every Friday, the Route & Team Tracker’s Weekly Dashboard has the diagnosis column from this article built into it: set the week-start date, and its “What this says” column reads each rep against your own team average in this exact order and prints “Low activity,” “Opening problem,” “Conversation problem” or “On track” — and “No days logged this week” before any of it.